Trends & Analytics
Track historical insights into your test suite's health with pass/fail trends, duration analysis, suite growth, and flaky test detection.
Date Range Selection
Use the date range dropdown to control the time window for all charts on the page. Available ranges depend on your subscription tier — some options like "Last 90 days" may show (Pro required) and be disabled on lower-tier plans.
Default ranges available on all plans:
- Last 7 days
- Last 14 days
Test Results Trends
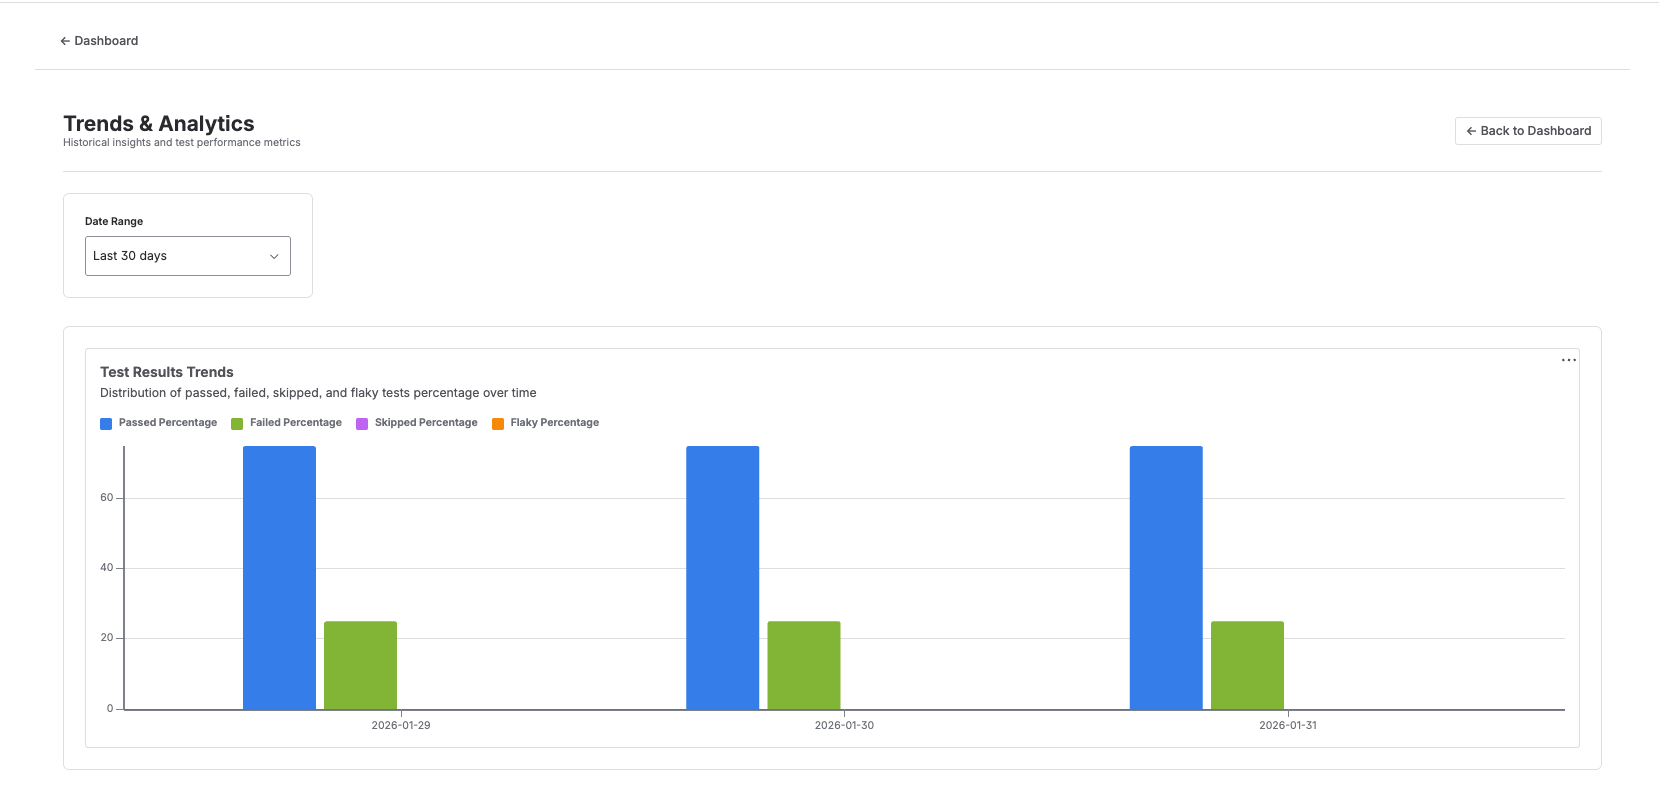
A grouped bar chart showing the percentage breakdown of test results per day:
- Passed % — tests that completed successfully
- Failed % — tests that returned errors
- Skipped % — tests that were not executed
- Flaky % — tests that passed on retry after an initial failure
Hover over any bar to see exact percentages for that day.
Average Test Duration
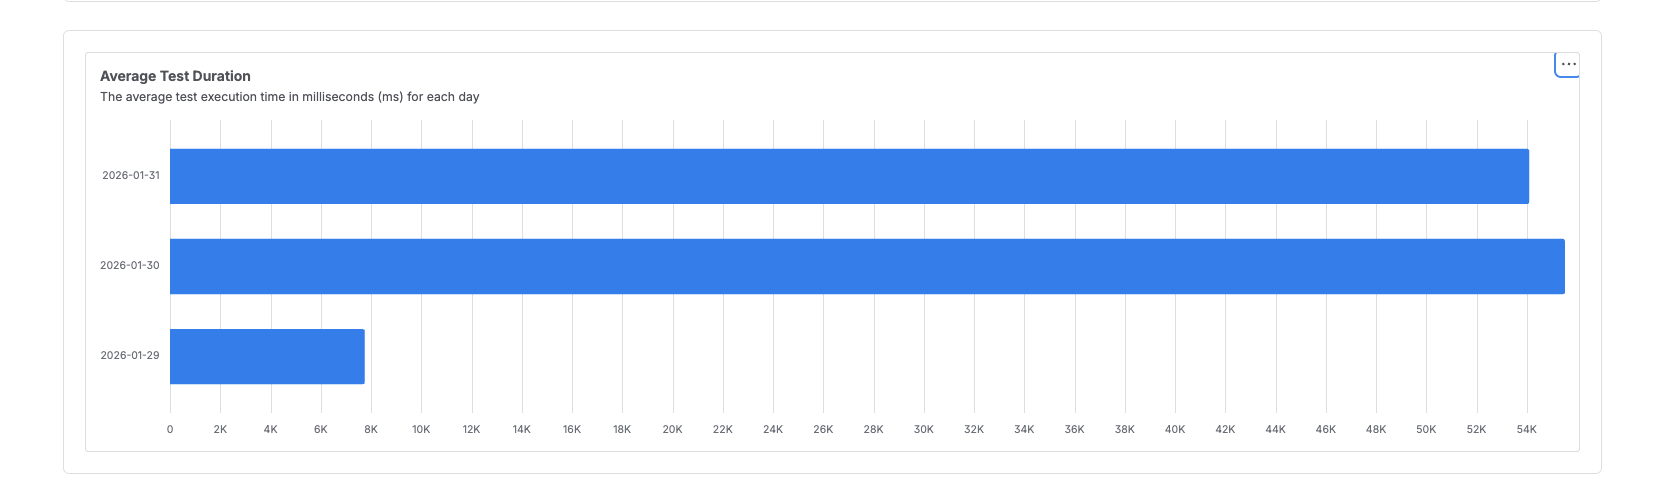
A horizontal bar chart displaying the average execution time in milliseconds per day. Use this to spot performance regressions or improvements in your test suite over time.
Test Suite Growth
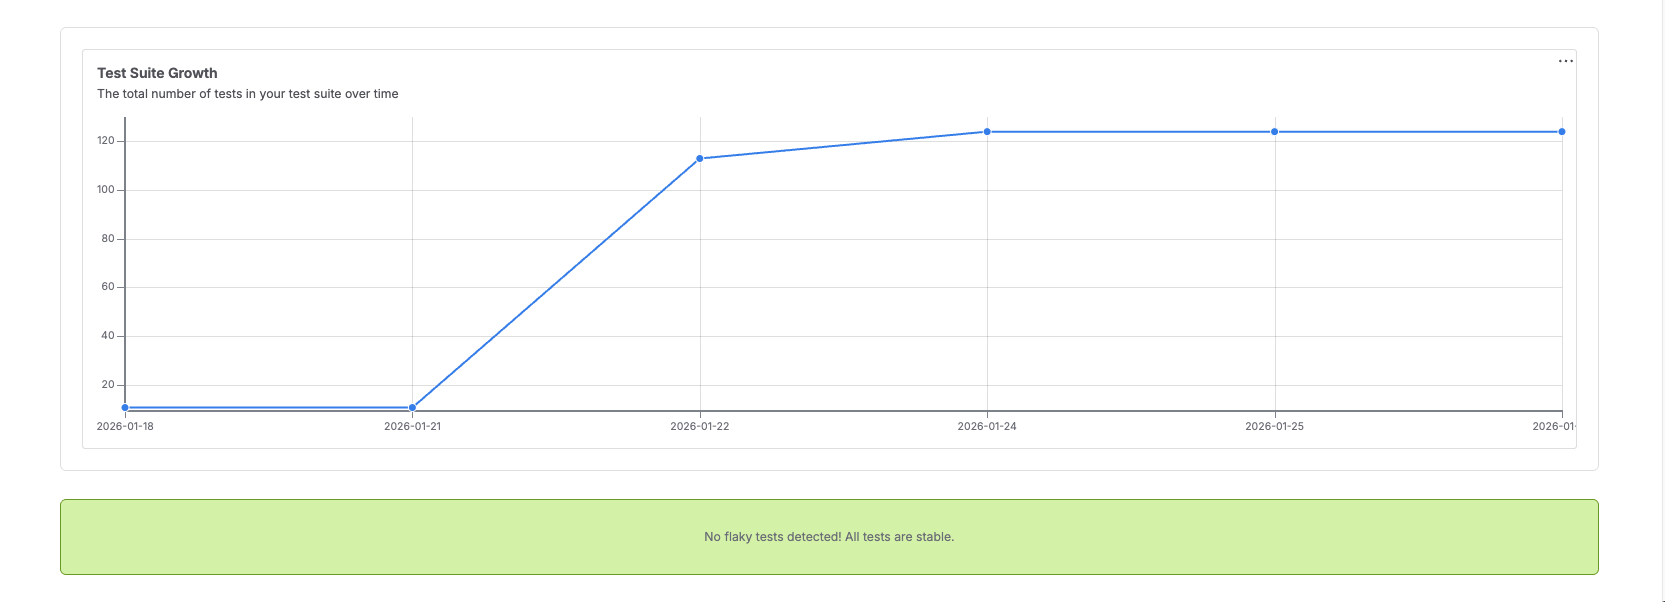
A line chart tracking the total number of tests over time. This helps you understand how quickly your test coverage is expanding.
Top Flaky Tests
(Visible at the bottom of the screenshot above)
A horizontal bar chart showing the top 10 tests ranked by flakiness percentage. If no flaky tests are detected, a success banner is displayed:
No flaky tests detected! All tests are stable.