Dashboard
Monitor your test suite's overall health with an intuitive dashboard that displays key metrics, test result distributions, and recent test runs — all at a glance.
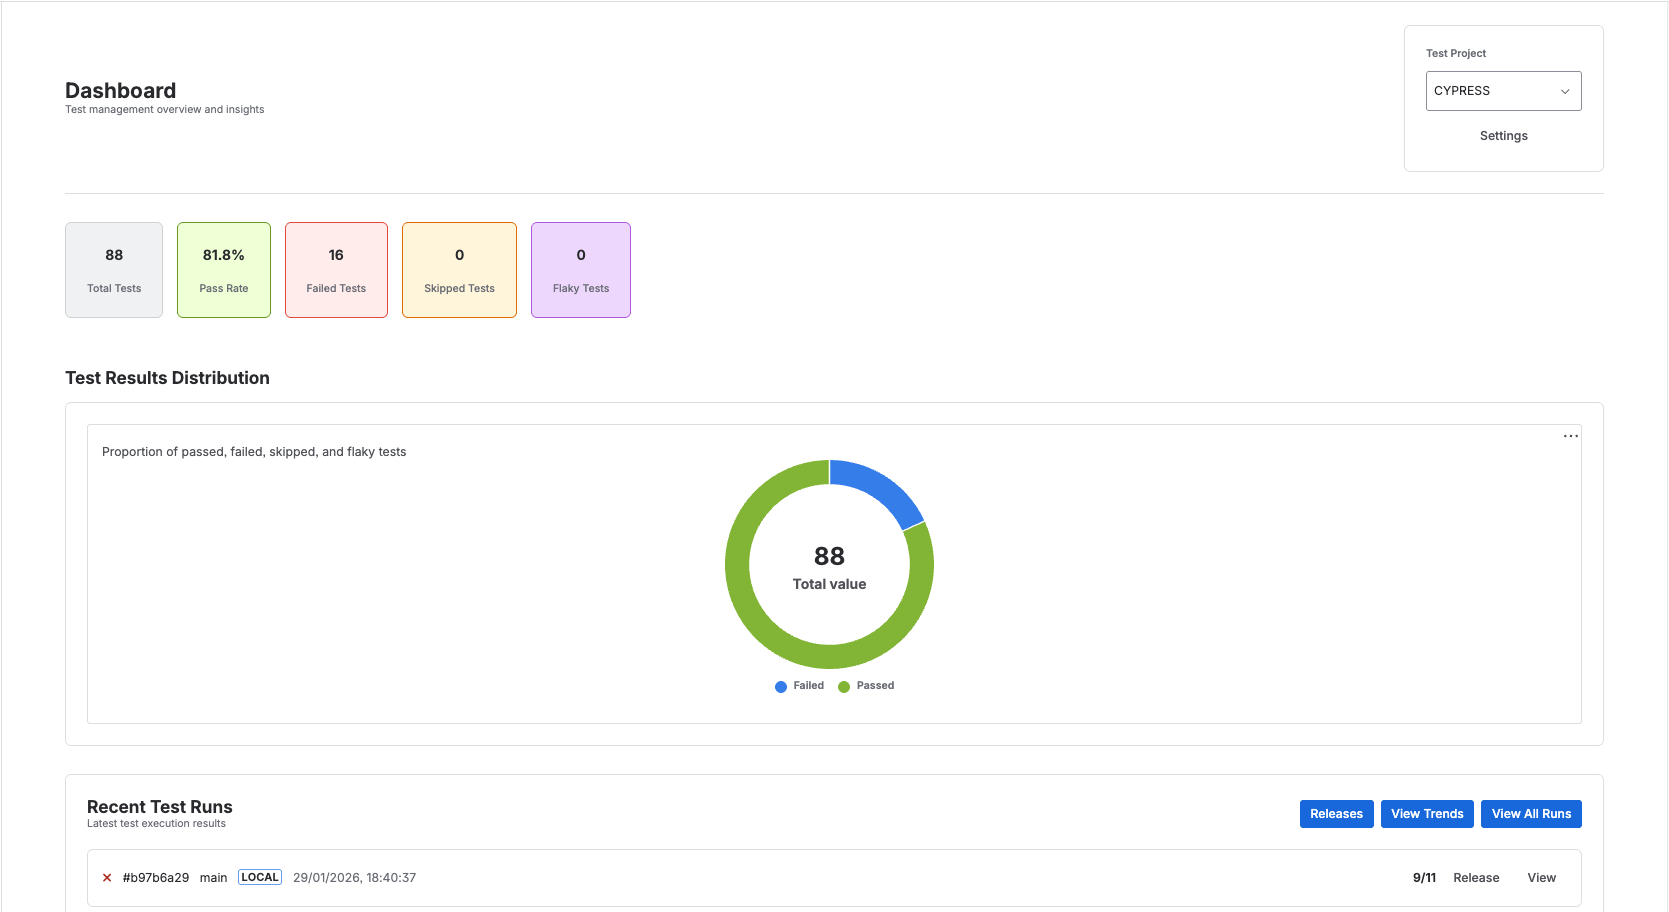
Test Metrics Cards
At the top of the dashboard, you'll see key metrics:
- Total Tests - Complete count of all tests in your suite
- Pass Rate - Overall success percentage
- Failed Tests - Number of currently failing tests
- Skipped Tests - Count of intentionally skipped tests
- Flaky Tests - Tests with inconsistent pass/fail behavior
Test Results Distribution
The donut chart visualizes your test results breakdown showing passed, failed, and skipped tests. This provides an at-a-glance view of test suite health.
Recent Test Runs
Below the metrics, you'll find a chronological list of recent test executions showing:
- Test run timestamp
- Duration
- Pass/fail counts
- Quick action buttons
Action Buttons
- Releases - Navigate to release-specific test results
- View Trends - Access analytics and historical data
- View All Runs - See complete test run history